Social Media


Popular features
Photo

Filters

Stock royalty-free photos and images of Trends
Discover unlimited high resolution images of Trends and stock visuals for commercial use.


A businesswoman looking through binoculars, seeing conflicting trends in earnings prediction, can be used for business vision or business prediction concept


Iron weathervane against horizontal cloudscape


Young Caucasian woman touching with the finger the highest column of a vertical bar chart on an interactive virtual screen or interface

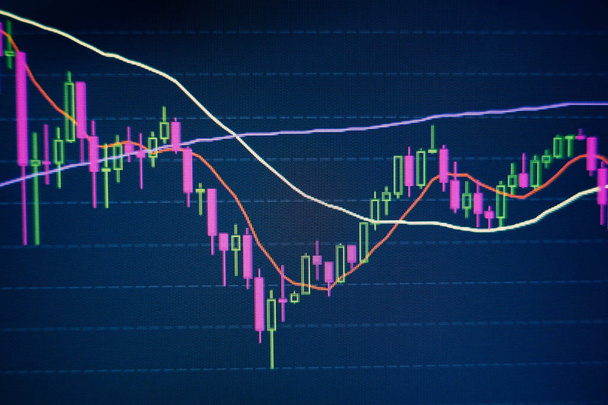
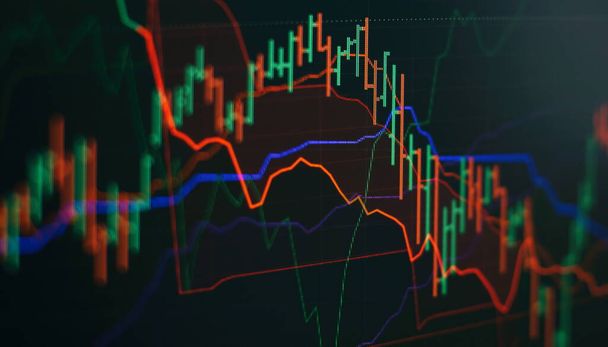
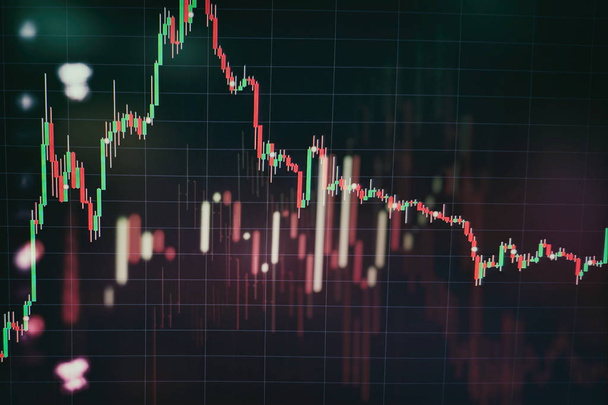
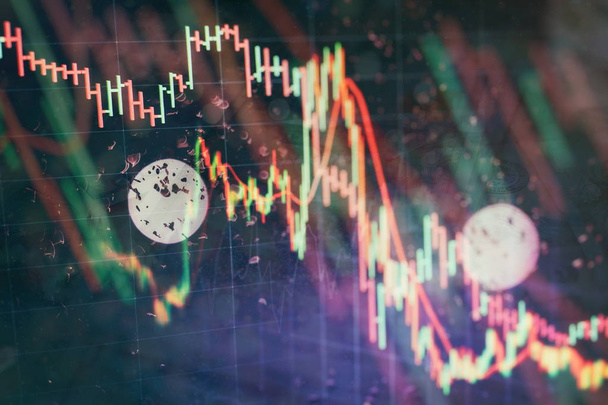
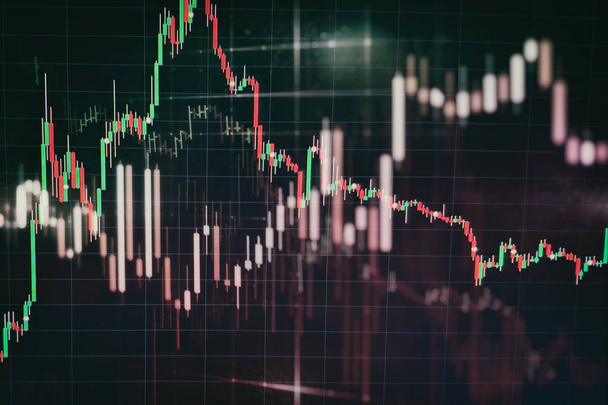
Stock market or forex trading graph and candlestick chart suitable for financial investment concept. Economy trends background for business idea and all art work design. Abstract finance background.

Message TRENDS 2016 on ascending arrow above bar graph of Wooden small cubes isolated on black background. Chalk drawing on blackboard. Business Concept image.

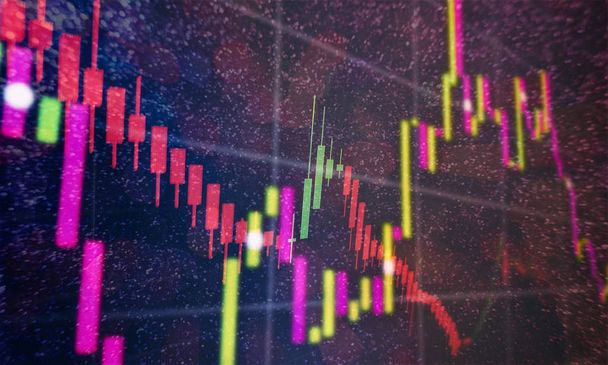
Stock and bitcoin market fluctuation on a screen. Encryption currency prices. - Image


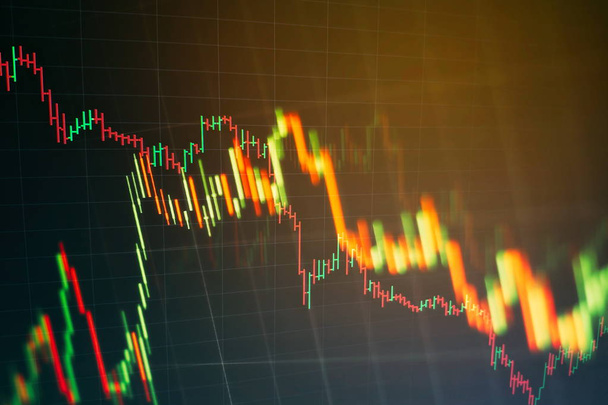
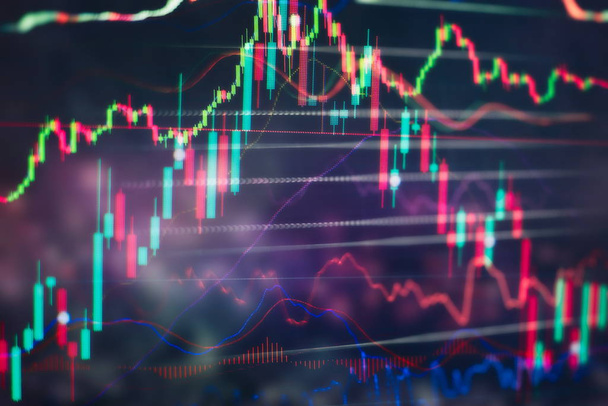
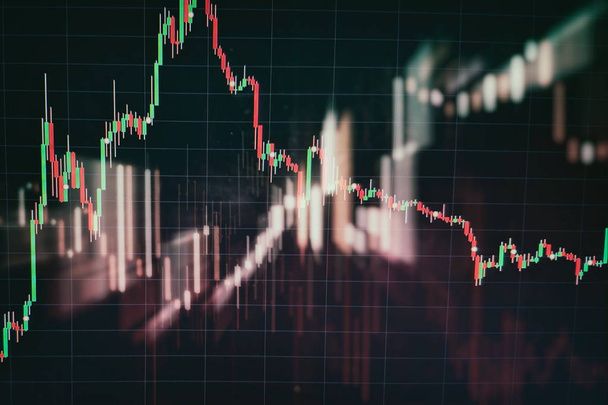
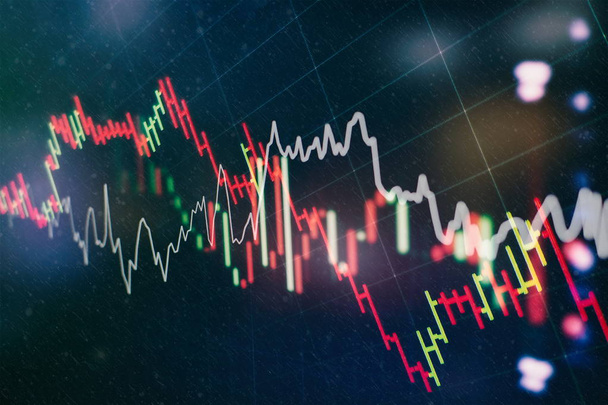
Stock market or forex trading graph and candlestick chart suitable for financial investment concept. Economy trends background for business idea and all art work design. Abstract finance background.

Charts of financial instruments with various type of indicators including volume analysis for professional technical analysis on the monitor of a computer. Fundamental and technical analysis concept.


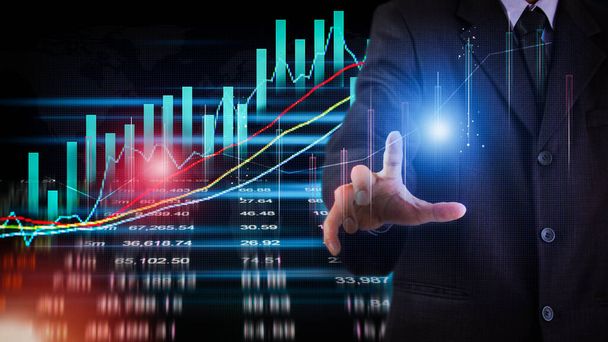
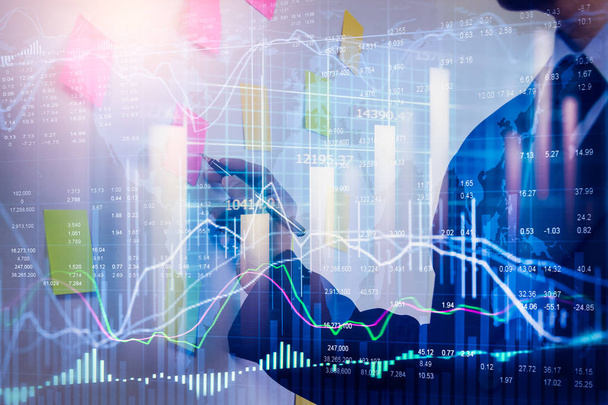
Hand touching graphs of financial indicator and accounting market economy analysis chart


Hand touching graphs of financial indicator and accounting market economy analysis chart

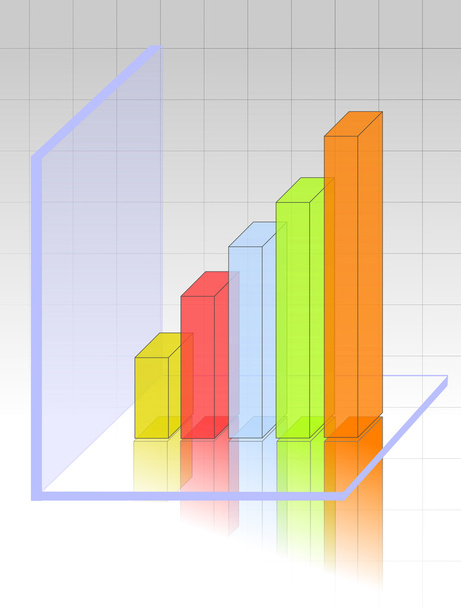
Transparent and colourful 3d graph


Hand touching graphs of financial indicator and accounting market economy analysis chart

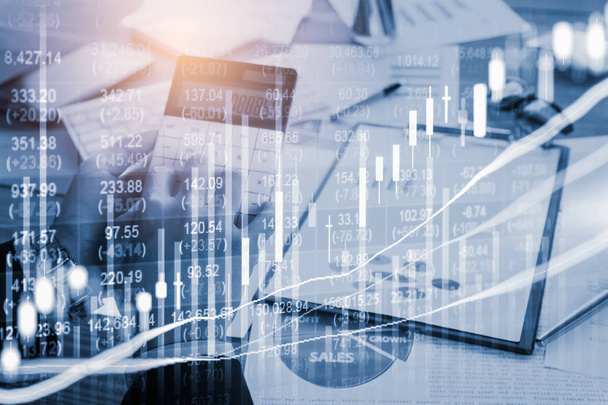
Business financial or stock market background. Business graph on stock market financial exchange


Luminous 2020 year numbers and network above man's hands at black background. New 2020 year technology concept.


Ascending Growth Trends Movement Performance Financial Chart Status Report

Forex market background, trading on the currency market Forex. Currency exchange rate for world currency: US Dollar, Euro,

Charts of financial instruments with various type of indicators including volume analysis for professional technical analysis on the monitor of a computer. Fundamental and technical analysis concept.


Hand touching graphs of financial indicator and accounting market economy analysis chart

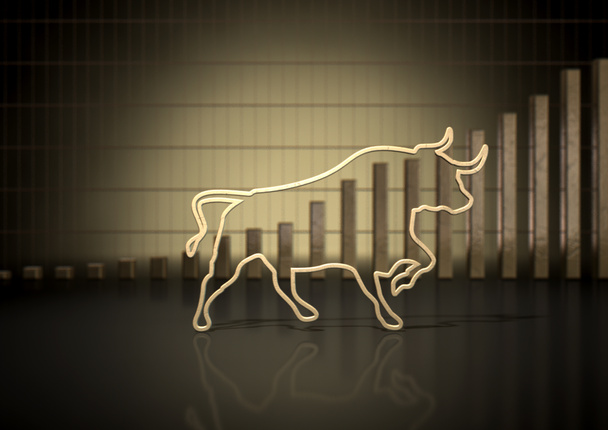
An abstract closeup of a gold outline depicting a stylized bull representing financial market trends on a bar graph background

Charts of financial instruments with various type of indicators including volume analysis for professional technical analysis on the monitor of a computer. Fundamental and technical analysis concept.


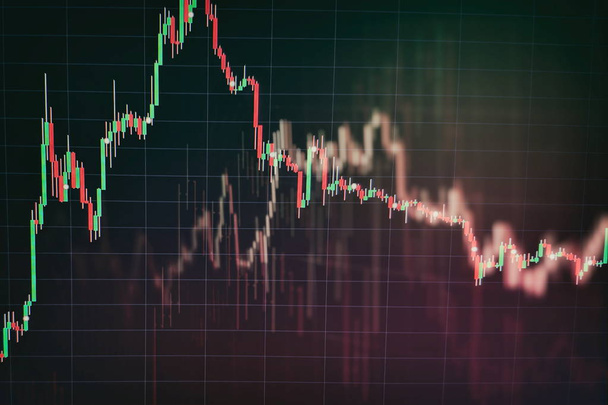
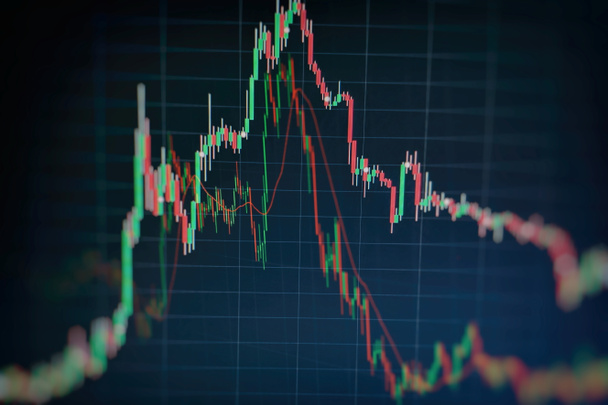
Stock market or forex trading graph and candlestick chart suitable for financial investment concept. Economy trends background for business idea and all art work design. Abstract finance background.

Economy trends background for business idea and all art work design. Abstract finance background.

Stock and bitcoin market fluctuation on a screen. Encryption currency prices. - Image

Charts of financial instruments with various type of indicators including volume analysis for professional technical analysis on the monitor of a computer. Fundamental and technical analysis concept.

Charts of financial instruments with various type of indicators including volume analysis for professional technical analysis on the monitor of a computer. Fundamental and technical analysis concept.

Charts of financial instruments with various type of indicators including volume analysis for professional technical analysis on the monitor of a computer. Fundamental and technical analysis concept.

Forex trading graph and candlestick chart suitable for financial investment concept. Economy trends background for business idea and all art work design. Abstract finance background

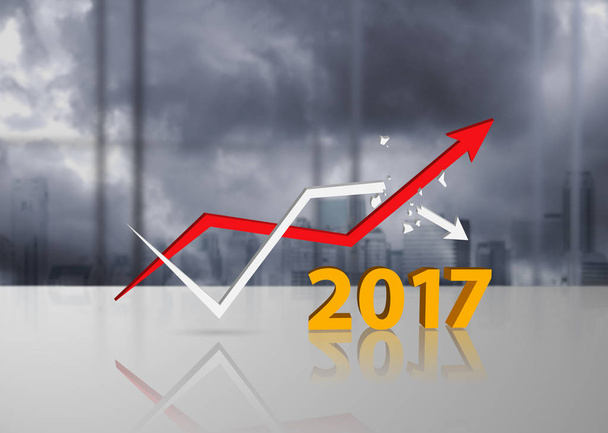
Trends 2017 concept with increasing and decreasing graphs


Airbrush illustration reflecting rising profits, outstanding performance and business success

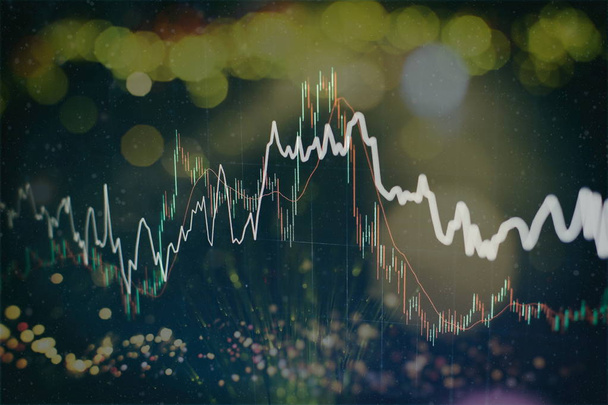
Stock market or forex trading graph and candlestick chart suitable for financial investment concept. Economy trends background for business idea and all art work design. Abstract finance background.


Ascending Growth Trends Movement Performance Financial Chart Status Report

Charts of financial instruments with various type of indicators including volume analysis for professional technical analysis on the monitor of a computer. Fundamental and technical analysis concept.


Ascending Growth Trends Movement Performance Financial Chart Status Report


Financial stock market investment trading graph. Candle stick graph chart. Bullish point, Bearish point. trend on technology abstract background


Stock market or forex trading graph and candlestick chart suitable for financial investment concept. Economy trends background for business idea and all art work design. Abstract finance background.


Hand touching graphs of financial indicator and accounting market economy analysis chart


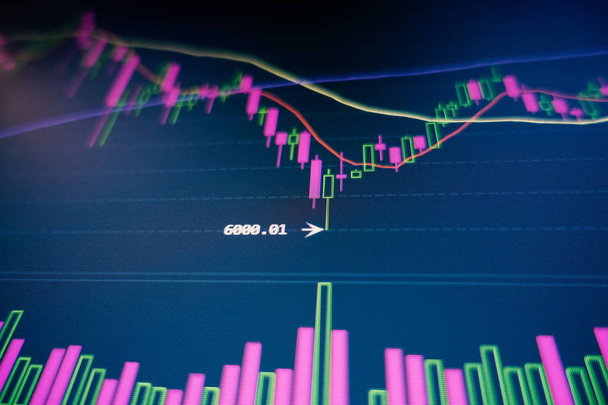
The Forex graph chart on the digital screen. Sustainable portfolio management, long term wealth management with risk diversification concept.


Ascending Growth Trends Movement Performance Financial Chart Status Report


Stock market or forex trading graph and candlestick chart suitable for financial investment concept. Economy trends background for business idea and all art work design. Abstract finance background.


Stock market or forex trading graph and candlestick chart suitable for financial investment concept. Economy trends background for business idea and all art work design. Abstract finance background.


Stock market or forex trading graph and candlestick chart suitable for financial investment concept. Economy trends background for business idea and all art work design. Abstract finance background.

Word Trends on ascending arrow above wooden cubes. Business Concept


Stock market or forex trading graph and candlestick chart suitable for financial investment concept. Economy trends background for business idea and all art work design. Abstract finance background.

Stock market or forex trading graph and candlestick chart suitable for financial investment concept. Economy trends background for business idea and all art work design. Abstract finance background.


An abstract closeup of two gold outlines depicting a stylized bull and a bear representing financial market trends on a bar graph background

Joyful man in white sweater wearing yellow mustard bobble hat on turquoise background, winter trends

Charts of financial instruments with various type of indicators including volume analysis for professional technical analysis on the monitor of a computer. Fundamental and technical analysis concept.

Business financial or stock market background. Business graph on stock market financial exchange


Stock market or forex trading graph and candlestick chart suitable for financial investment concept. Economy trends background for business idea and all art work design. Abstract finance background.


Stock market or forex trading graph and candlestick chart suitable for financial investment concept. Economy trends background for business idea and all art work design. Abstract finance background.


Work word